Report · One-off
Revenue in the Latvian Register
Of the 106,685 Latvian limited companies that filed accounts for 2025, 7,977 turned over EUR 1M or more, 7.5%, and 1,181 turned over EUR 10M or more. The median company with any turnover took in EUR 57,161, and the largest 1% of companies account for 57.7% of all turnover. Over five years the same companies grew turnover by 35.1%, while prices rose 38.9%.
How Much Turnover Do Latvian Companies Make?
The median Latvian limited company with any turnover took in EUR 57,161 in 2025, while 21.8% of filers reported none. Only 7,977, 7.5%, turned over EUR 1M or more, and the largest 10% of companies account for 88.0% of all turnover.
Companies with no turnover are the subject of the activity gap report. 33.1% turned over EUR 10,000 to 99,999 and 23.7% EUR 100,000 to 999,999. Above that the numbers thin quickly: 6,796 companies between EUR 1M and 9.9M, 961 between EUR 10M and 49.9M, and 220 at EUR 50M or more.
Companies by net turnover, 2025
- None23,308 companies
- Under EUR 10,00014,810 companies
- EUR 10,000 to 99,99935,309 companies
- EUR 100,000 to 999,99925,281 companies
- EUR 1M to 9.9M6,796 companies
- EUR 10M to 49.9M961 companies
- EUR 50M or more220 companies
Show the numbers
| Net turnover | Companies | Share |
|---|---|---|
| None | 23,308 | 21.8% |
| Under EUR 10,000 | 14,810 | 13.9% |
| EUR 10,000 to 99,999 | 35,309 | 33.1% |
| EUR 100,000 to 999,999 | 25,281 | 23.7% |
| EUR 1M to 9.9M | 6,796 | 6.4% |
| EUR 10M to 49.9M | 961 | 0.9% |
| EUR 50M or more | 220 | 0.2% |
What Is Revenue per Employee at Latvian Companies?
It rises with company size. Among companies with staff and turnover, the median is EUR 27,357 a year per employee at companies with one employee, EUR 58,155 at ten to 49, and EUR 87,070 at 250 or more. Across all of them it is EUR 35,443.
At two to nine employees the median is EUR 35,493, and at 50 to 249 it is EUR 77,954. Few companies are large: 9.1% of filers employ ten or more, 1.6% employ 50 or more, and 250 companies employ 250 or more. 24.2% report no employees.
Median turnover per employee, by company size, 2025
- 1 employee27,357 EUR a year
- 2 to 935,493 EUR a year
- 10 to 4958,155 EUR a year
- 50 to 24977,954 EUR a year
- 250 or more87,070 EUR a year
Show the numbers
| Employees | Companies | Median per employee |
|---|---|---|
| 1 employee | 29,199 | EUR 27,357 |
| 2 to 9 | 34,513 | EUR 35,493 |
| 10 to 49 | 8,012 | EUR 58,155 |
| 50 to 249 | 1,453 | EUR 77,954 |
| 250 or more | 250 | EUR 87,070 |
How Many Latvian Companies Reach EUR 1M in Turnover?
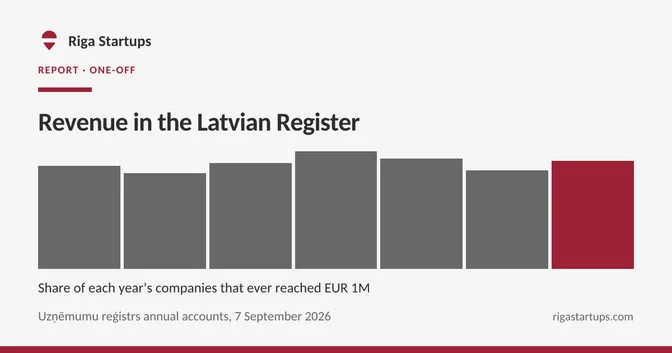
Few. Of every limited company registered in each year from 2014 to 2020, active or since closed, between 4.0% and 4.9% reached EUR 1M in turnover within 5 financial years, and between 0.3% and 0.6% reached EUR 10M.
Counting every company registered, not only the survivors, is what keeps the figure honest: most of a year’s companies never file a large turnover, and many are gone.
Among the 4,104 companies from those years that have reached EUR 1M at any point, 9.1% did so in the year they were registered and 24.2% a year later; half had done so within 3 years of registration, and 21.0% took six years or more. The register cannot tell a new venture from a company set up to take over an existing business, so the fastest crossings include some of both.
Reaching EUR 1M within 5 years, by year registered
- Registered 20144.3 % reaching EUR 1M
- Registered 20154 % reaching EUR 1M
- Registered 20164.4 % reaching EUR 1M
- Registered 20174.9 % reaching EUR 1M
- Registered 20184.6 % reaching EUR 1M
- Registered 20194.1 % reaching EUR 1M
- Registered 20204.5 % reaching EUR 1M
Show the numbers
| Registered | Companies | Reached EUR 1M | Share | Reached EUR 10M | Share |
|---|---|---|---|---|---|
| 2014 | 14,051 | 605 | 4.3% | 61 | 0.4% |
| 2015 | 12,610 | 503 | 4.0% | 49 | 0.4% |
| 2016 | 10,370 | 459 | 4.4% | 48 | 0.5% |
| 2017 | 9,401 | 458 | 4.9% | 55 | 0.6% |
| 2018 | 9,923 | 452 | 4.6% | 34 | 0.3% |
| 2019 | 9,629 | 391 | 4.1% | 33 | 0.3% |
| 2020 | 8,261 | 373 | 4.5% | 34 | 0.4% |
How long it took to reach EUR 1M
- In the year of registration372 companies
- 1 year later992 companies
- 2 years later600 companies
- 3 years later481 companies
- 4 years later435 companies
- 5 years later361 companies
- 6 years or more later863 companies
Show the numbers
| First year at EUR 1M | Companies | Share |
|---|---|---|
| In the year of registration | 372 | 9.1% |
| 1 year later | 992 | 24.2% |
| 2 years later | 600 | 14.6% |
| 3 years later | 481 | 11.7% |
| 4 years later | 435 | 10.6% |
| 5 years later | 361 | 8.8% |
| 6 years or more later | 863 | 21.0% |
Has Latvian Company Turnover Grown Faster Than Prices?
Not for the typical company. The 57,983 companies that reported turnover in both 2020 and 2025 grew it by a median 35.1%, against consumer prices up 38.9%, so in real terms the typical company turned over about 2.7% less than five years earlier.
Total turnover in 2025 prices went from EUR 84.3bn to EUR 79.9bn, after a peak of EUR 97.9bn in 2022, and the number of companies turning over EUR 1M or more in 2025 prices from 8,518 to 7,977.
Formation ran the other way. 8,261 limited companies were registered in 2020 and 9,300 in 2025, while the number reporting any turnover moved from 86,899 to 83,377.
Total turnover of limited companies, in 2025 prices
Show the numbers
| Year | Reporting turnover | Total, nominal | Total, 2025 prices | EUR 1M or more, 2025 prices | Formations |
|---|---|---|---|---|---|
| 2014 | 79,176 | EUR 49.9bn | EUR 75.4bn | 7,681 | 14,051 |
| 2015 | 82,455 | EUR 51.3bn | EUR 77.4bn | 7,797 | 12,610 |
| 2016 | 84,972 | EUR 51.8bn | EUR 78.1bn | 8,060 | 10,370 |
| 2017 | 85,559 | EUR 56.9bn | EUR 83.4bn | 8,383 | 9,401 |
| 2018 | 86,392 | EUR 63.0bn | EUR 90.0bn | 8,713 | 9,923 |
| 2019 | 87,450 | EUR 65.0bn | EUR 90.3bn | 8,889 | 9,629 |
| 2020 | 86,899 | EUR 60.7bn | EUR 84.3bn | 8,518 | 8,261 |
| 2021 | 85,485 | EUR 70.4bn | EUR 94.7bn | 9,007 | 8,519 |
| 2022 | 84,258 | EUR 85.3bn | EUR 97.9bn | 9,073 | 7,924 |
| 2023 | 84,969 | EUR 82.2bn | EUR 86.5bn | 8,468 | 7,790 |
| 2024 | 85,411 | EUR 81.8bn | EUR 84.9bn | 8,475 | 8,219 |
| 2025 | 83,377 | EUR 79.9bn | EUR 79.9bn | 7,977 | 9,300 |
How Are Errors Kept Out of Latvian Turnover Totals?
By a units-error rule. One wrong filing can move a total by billions, so a company year over EUR 100M and more than 50 times each neighbouring year on file is treated as a units error, and 5 such company years are left out of every figure in this report.
A single 2018 report marked as rounded to thousands but written in euros, for example, multiplies that company’s turnover a thousand times. After that, the register’s limited companies turned over EUR 81.8bn in 2024, against EUR 82.6bn in Eurostat’s structural business statistics for Latvia's industry, construction and market services. The two are different populations, every legal form on one side and limited companies including finance on the other, but they are the same size, which is what a units error would have broken.
How Much Revenue Do Startups on This Map Make?
The median mapped company with turnover took in EUR 89,745. Of the 465 startups and scaleups on this map that filed 2025 accounts, 82.8% reported turnover, against 78.2% across the register, and 13.3% turned over EUR 1M or more, against 7.5%.
Among the 322 with staff the median per employee was EUR 50,978, against EUR 35,443 for the register.
Figures by sector would need a sector for each company, which only the map records, and no mapped sector is large enough: the largest, SaaS, has 86 companies with 2025 accounts, under the 200 a median needs.
What Can Latvian Company Revenue Data Not Tell You?
Profit, since turnover is sales and a company can turn over millions and lose money; turnover by industry across the register, because Latvia publishes no industry classification per company; group totals, since sales within a group are counted in both companies; and anything about sole traders or the self-employed.
- Profit. Turnover is sales. A company can turn over millions and lose money.
- Turnover by industry across the register. Latvia publishes no industry classification for each company, as the methodology page explains.
- Group totals. Each company files its own accounts, so sales between companies in the same group are counted in both.
- Sole traders and the self-employed. Only limited companies are counted.
Frequently Asked Questions
What Is the Median Turnover of a Latvian Company?
The median Latvian limited company with any turnover took in EUR 57,161 in 2025, from the accounts of 106,685 companies that filed for that year.
How Many Latvian Companies Turn Over EUR 1M or More?
7,977 Latvian limited companies, 7.5% of those that filed 2025 accounts, turned over EUR 1M or more, and 1,181 turned over EUR 10M or more.
How Concentrated Is Turnover Among Latvian Companies?
Highly. The largest 1% of Latvian limited companies account for 57.7% of all turnover, and the largest 10% for 88.0%.
How Long Does It Take a Latvian Company to Reach EUR 1M?
Among companies registered from 2014 to 2020 that reached EUR 1M, 9.1% did so in the year they were registered and 24.2% a year later, while 21.0% took six years or more.
Does Turnover Show Whether a Latvian Company Is Profitable?
No. Turnover is sales, and a company can turn over millions and still lose money. This report reads turnover and headcount from the accounts, not profit.
Method
- Accounts. Company annual reports of SIA and AS in euros, the latest filing for each company and year, amounts reported in thousands scaled.
- Reaching a threshold. The first financial year with net turnover at or above it, counted from the year of registration, which is year zero.
- Real terms. Eurostat’s annual average harmonised consumer price index for Latvia.
- Growth. The same companies in both years, median of each company’s change.
- Withheld figures. A count from 1 to 19 is shown as fewer than 20, and no median or share is published over fewer than 200 companies.
Definitions are frozen at version 4. The full set is on the methodology page.
Cite This
Sageo SIA (2026). Revenue in the Latvian Register. Riga Startups. Computed from Uzņēmumu reģistrs annual report financial data, extract of 7 September 2026, and Eurostat consumer prices and structural business statistics, updated 6 February 2026. https://rigastartups.com/reports/revenue
Permalink: https://rigastartups.com/reports/revenue · CSV for this edition
The Register publishes its financial data as CC0, and Eurostat data are free to reuse with attribution. This analysis is offered on the same terms: credit the sources and link back.
Sources
- Uzņēmumu reģistrs, annual report financial data. Extract of 7 September 2026.
- Uzņēmumu reģistrs open data, the company register. Extract of 4 September 2026.
- Eurostat, harmonised consumer prices (prc_hicp_aind), and structural business statistics (sbs_ovw_act).