Report · One-off
Skilled Migration to Latvia
Latvia issued 89 first-time EU Blue Cards in 2025, down 72% from 318 in 2023. Lithuania issued 2,314, 26 times as many, and Estonia 43. Every comparison here uses one Eurostat definition across all three countries, which their national statistics do not allow.
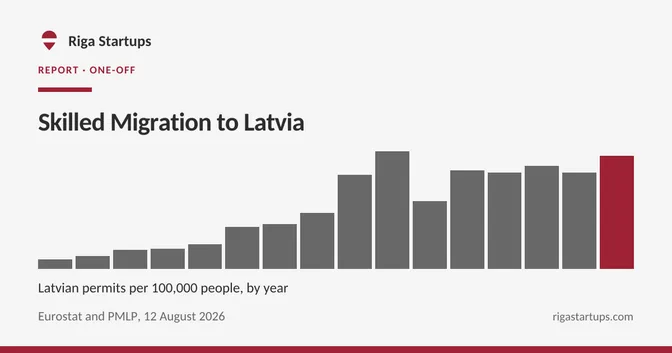
How Many EU Blue Cards Does Latvia Issue?
Latvia issued 89 first-time EU Blue Cards in 2025, down 72% from a peak of 318 in 2023. Other employment permits held up over the same years, at 4,013 in 2025, so the fall is in the Blue Card specifically, not in hiring from outside the EU.
First-time Blue Cards had risen from 32 in 2014 to that peak, and the 2025 figure is the fewest since 2020.
Eurostat does not say why, and nor does this report. A fall in grants cannot be told apart from a fall in applications, because applications are not published for any route.
First-time EU Blue Cards issued by Latvia
Show the numbers
| Year | Blue Card | Highly skilled | Researchers | Other employment |
|---|---|---|---|---|
| 2014 | 32 | 122 | fewer than 20 | 811 |
| 2015 | 71 | 143 | fewer than 20 | 1,422 |
| 2016 | 113 | 144 | fewer than 20 | 1,474 |
| 2017 | 168 | 100 | fewer than 20 | 1,885 |
| 2018 | 215 | 155 | fewer than 20 | 3,199 |
| 2019 | 177 | 113 | fewer than 20 | 4,151 |
| 2020 | 43 | 70 | fewer than 20 | 2,429 |
| 2021 | 184 | 95 | 22 | 3,384 |
| 2022 | 298 | 69 | fewer than 20 | 3,180 |
| 2023 | 318 | 49 | fewer than 20 | 3,464 |
| 2024 | 158 | 40 | fewer than 20 | 3,349 |
| 2025 | 89 | 36 | fewer than 20 | 4,013 |
How Does Latvia Compare With Lithuania and Estonia on Skilled Migration?
Lithuania issued 2,314 Blue Cards in 2025, 26 times Latvia’s 89, and Estonia 43. Lithuania’s lead comes mostly from Belarus, 68.2% of its Blue Cards, and per resident it admitted 6.5 times as many people for work as Latvia, with Estonia fewer than either.
Belarus alone accounts for 1,577 of Lithuania’s 2,314 Blue Cards. In Latvia the named nationalities are India with 44 and Russia with 21, and 24 from everywhere else.
Blue Cards issued in 2025
- Lithuania2,314 Blue Cards
- Latvia89 Blue Cards
- Estonia43 Blue Cards
Show the numbers
| Country | Blue Cards | All employment permits | Per 100,000 residents |
|---|---|---|---|
| Latvia | 89 | 4,151 | 223.1 |
| Estonia | 43 | 1,098 | 80.1 |
| Lithuania | 2,314 | 42,030 | 1,454 |
Employment permits per 100,000 residents
Show the numbers
| Year | Latvia | Estonia | Lithuania |
|---|---|---|---|
| 2015 | 82.5 | 97.4 | 95.3 |
| 2016 | 88.2 | 101.8 | 141 |
| 2017 | 110.7 | 116.4 | 264.8 |
| 2018 | 184.8 | 135.8 | 336.4 |
| 2019 | 231.6 | 158.7 | 654.1 |
| 2020 | 133.4 | 153.1 | 695.2 |
| 2021 | 194.6 | 172.2 | 567.1 |
| 2022 | 189.2 | 175.8 | 796.4 |
| 2023 | 202.5 | 151.2 | 1,642.1 |
| 2024 | 189.4 | 102.5 | 1,550.4 |
| 2025 | 223.1 | 80.1 | 1,454 |
Lithuania's Blue Cards by nationality, 2025
- Belarus1,577 Blue Cards
- Russia295 Blue Cards
- India173 Blue Cards
- Ukraine63 Blue Cards
- Türkiye33 Blue Cards
- Philippines24 Blue Cards
- Pakistan21 Blue Cards
- Other128 Blue Cards
Show the numbers
| Nationality | Blue Cards | Share |
|---|---|---|
| Belarus | 1,577 | 68.2% |
| Russia | 295 | 12.7% |
| India | 173 | 7.5% |
| Ukraine | 63 | 2.7% |
| Türkiye | 33 | 1.4% |
| Philippines | 24 | 1% |
| Pakistan | 21 | 0.9% |
| Other | 128 |
Who Receives Latvian Employment Permits?
Outside the Blue Card, Latvia’s 4,013 employment permits in 2025 went mainly to Uzbekistan (35.7%), India (14.4%), Tajikistan (11.3%). That is a different population from the Blue Card, and the permits carry no occupation, so nothing in the data says how many of them were for skilled or technical work.
Latvia's other employment permits by nationality, 2025
- Uzbekistan1,433 permits
- India578 permits
- Tajikistan455 permits
- Belarus222 permits
- Philippines155 permits
- Viet Nam120 permits
- China107 permits
- Ukraine103 permits
- Moldova96 permits
- Pakistan93 permits
- Kyrgyzstan85 permits
- Turkmenistan61 permits
- Azerbaijan58 permits
- Georgia52 permits
- Kazakhstan49 permits
- Türkiye37 permits
- North Macedonia31 permits
- Armenia29 permits
- Bangladesh28 permits
- United States22 permits
- Albania20 permits
- Other179 permits
Show the numbers
| Nationality | Permits | Share |
|---|---|---|
| Uzbekistan | 1,433 | 35.7% |
| India | 578 | 14.4% |
| Tajikistan | 455 | 11.3% |
| Belarus | 222 | 5.5% |
| Philippines | 155 | 3.9% |
| Viet Nam | 120 | 3% |
| China | 107 | 2.7% |
| Ukraine | 103 | 2.6% |
| Moldova | 96 | 2.4% |
| Pakistan | 93 | 2.3% |
| Kyrgyzstan | 85 | 2.1% |
| Turkmenistan | 61 | 1.5% |
| Azerbaijan | 58 | 1.4% |
| Georgia | 52 | 1.3% |
| Kazakhstan | 49 | 1.2% |
| Türkiye | 37 | 0.9% |
| North Macedonia | 31 | 0.8% |
| Armenia | 29 | 0.7% |
| Bangladesh | 28 | 0.7% |
| United States | 22 | 0.5% |
| Albania | 20 | 0.5% |
| Other | 179 |
What Jobs Are Latvian EU Blue Cards Issued For?
The Blue Card is the one route that records an occupation. In 2023, 177 of Latvia’s 419 Blue Card grants went to information and communication technology professionals, 42.2%. Then the series stops: from 2024 Latvia reports every Blue Card decision to Eurostat under an unknown occupation.
In earlier years the ICT share was higher, as the chart shows. Whether the fall since 2023 came out of ICT hiring or somewhere else is not answerable from any published source. Estonia reports occupation throughout: 63 of its 67 grants in 2025 were ICT professionals, too few to express as a share under the rules used here. Lithuania has never reported occupation for its Blue Cards.
ICT professionals as a share of Latvia's Blue Card grants
- 201778.6 %
- 201874.2 %
- 201969.1 %
- 202170.8 %
- 202270.3 %
- 202342.2 %
Show the numbers
| Year | Grants | ICT professionals | Share |
|---|---|---|---|
| 2012 | fewer than 20 | fewer than 20 | |
| 2013 | fewer than 20 | fewer than 20 | |
| 2014 | 32 | fewer than 20 | |
| 2015 | 87 | 63 | |
| 2016 | 112 | 89 | |
| 2017 | 201 | 158 | 78.6% |
| 2018 | 213 | 158 | 74.2% |
| 2019 | 217 | 150 | 69.1% |
| 2020 | 69 | 40 | |
| 2021 | 226 | 160 | 70.8% |
| 2022 | 357 | 251 | 70.3% |
| 2023 | 419 | 177 | 42.2% |
| 2024 | 484 | not reported | |
| 2025 | 329 | not reported |
How Often Are EU Blue Card Applications Rejected in Latvia?
Eurostat has published rejected Blue Card applications since 2024. Latvia rejected 31 in 2024 (6% of decisions) and 27 in 2025 (7.6% of decisions). Estonia rejected 0 in 2024 and 0 in 2025. For Lithuania fewer than 20 in 2024, and nothing is reported for 2025. No source publishes refusals of ordinary employment permits.
How Did Latvian Work Permits Change in the First Half of 2026?
Against the first half of 2025, first-time permits for employees went from 1,829 to 2,170, Blue Cards from 49 to 40, and permits for every reason from 7,130 to 6,543. The file holds only about six weeks after the May 2026 amendments, so read it as the transition.
The Immigration Law was amended with effect from 20 May 2026. PMLP’s file for the first half of the year runs to 30 June 2026, so it holds about six weeks after the change, and the amendments narrowed the startup founder route rather than the Blue Card or the employment permit. Read what follows as the transition, not the outcome.
The other skilled routes were each fewer than 20 in both halves. These are PMLP counts, which differ from Eurostat’s, so they are not placed beside the figures above. The founder route itself is counted in the startup visa guide.
What Can Latvian Skilled Migration Data Not Tell You?
How many employment permits are for tech jobs, since only the Blue Card records an occupation; whether fewer grants means fewer applicants, because applications are not published; what the May 2026 amendments did, which six weeks cannot measure; and why Latvia’s Blue Card fell, since the statistics count permits, not reasons.
- How many employment permits are for tech jobs. Only the Blue Card records an occupation. The ICT share above describes the Blue Card and nothing else.
- Whether fewer grants means fewer applicants. Applications are not published for any route, in Latvia or by Eurostat.
- What the May 2026 amendments did. Six weeks of one half-year is not a measurement of a policy. The first full year after the change is 2026, published in 2027.
- Why Latvia’s Blue Card fell. The statistics count permits, not reasons, and a salary threshold, an employer’s choice of route and a change in demand all look the same from here.
Frequently Asked Questions
How Many Work Permits Does Latvia Issue?
Latvia issued 4,151 first-time employment permits in 2025 on Eurostat’s definition, 223.1 per 100,000 residents, of which 89 were EU Blue Cards.
Does Latvia Issue More EU Blue Cards Than Estonia and Lithuania?
More than Estonia, fewer than Lithuania. Latvia issued 89 first-time EU Blue Cards in 2025, Estonia 43 and Lithuania 2,314, 26 times Latvia’s.
Which Nationalities Get Latvian Work Permits?
Outside the Blue Card, Latvia’s 4,013 employment permits in 2025 went mainly to Uzbekistan (35.7%), India (14.4%), Tajikistan (11.3%). The permits carry no occupation.
Why Did Latvia Issue Fewer EU Blue Cards?
Published data cannot say. The statistics count permits, not reasons, and applications are not published for any route, so a salary threshold, an employer’s choice of route and a change in demand all look the same.
Where Does Skilled Migration Data for the Baltics Come From?
Every cross-country comparison uses Eurostat first permits, which apply one definition to every member state. The first half of 2026 comes from PMLP, Latvia’s migration authority, whose counts differ from Eurostat’s.
Method
- One definition for comparisons. Every cross-country figure is Eurostat, which applies the same rules to each member state. Latvia’s own statistics count its permits differently, so they are used only for the half-year read that Eurostat does not publish.
- First permits. A first permit is one issued to a person for the first time for that reason, not a renewal. The occupation figures are decisions to grant, which also include changes of status, and are labelled as such.
- Withheld counts. A count from 1 to 19 is shown as fewer than 20, and a share is published only over a denominator of at least 200. A nationality under 20 is summed into Other.
- Per resident. Permits divided by Eurostat population on 1 January of the same year, per 100,000.
Definitions are frozen at version 4, added bamboohr to the machine readable boards. The full set is on the methodology page.
Cite This
Sageo SIA (2026). Skilled Migration to Latvia. Riga Startups. Computed from Eurostat migration statistics, updated 2026-08-12, and PMLP residence permit statistics. https://rigastartups.com/reports/skilled-migration
Permalink: https://rigastartups.com/reports/skilled-migration · CSV for this edition
The underlying statistics are published by Eurostat and PMLP, free to reuse with attribution to them. This analysis is offered on the same terms: credit the sources and link back.
Sources
- Eurostat, first permits issued for remunerated activities (migr_resocc), by reason and citizenship. Updated 12 August 2026.
- Eurostat, EU Blue Card decisions by occupation (migr_resbc11), and rejected EU Blue Card applications (migr_resbc41).
- Eurostat, population on 1 January (demo_pjan).
- PMLP residence permit statistics, first-time temporary residence permits for the first half of 2025 and of 2026.