Report · One-off
Company Formations in the Baltic States
In 2024 Estonia registered 26.5 limited-liability companies for every 1,000 residents aged 15 to 64, 3.8 times Latvia’s 6.9. Lithuania registered 7.6. The figure usually quoted for Lithuania is 2.1, because its source leaves out the small partnership, which is now most of what Lithuanians register.
How Many Companies Are Registered in Latvia, Estonia, and Lithuania?
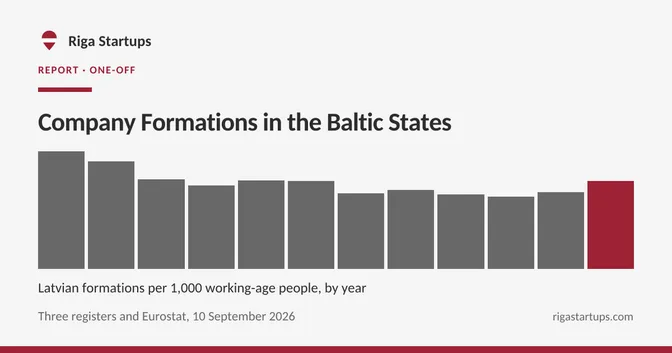
In 2024 Estonia registered 26.5 limited-liability companies for every 1,000 residents aged 15 to 64, 3.8 times Latvia’s 6.9, and Lithuania registered 7.6. Since 2014, Estonia’s and Lithuania’s rates have risen while Latvia’s has fallen, with Lithuania passing Latvia in 2021.
From 2014 to 2024 Estonia’s rate rose from 16.0 to 26.5 per 1,000. Latvia’s fell from 10.6 to 6.9. Lithuania’s rose from 5.4 to 7.6.
Latvia and Lithuania are counted from their own registers, which run to 2025. Estonia is taken from the World Bank Entrepreneurship Database, which is drawn from Estonia’s register and runs to 2024. Where the two sources can be checked against each other they agree: for Latvia in 2024 the World Bank counts 8,218 new companies and the register 8,219.
Limited-liability company formations per 1,000 residents aged 15 to 64
Show the numbers
| Year | Estonia | Lithuania | Latvia | Companies, EE | Companies, LT | Companies, LV |
|---|---|---|---|---|---|---|
| 2014 | 16.0 | 5.4 | 10.6 | 13,867 | 10,597 | 14,051 |
| 2015 | 17.5 | 4.0 | 9.7 | 15,005 | 7,916 | 12,610 |
| 2016 | 19.4 | 4.4 | 8.1 | 16,572 | 8,518 | 10,370 |
| 2017 | 21.8 | 5.0 | 7.5 | 18,461 | 9,550 | 9,401 |
| 2018 | 23.6 | 5.5 | 8.0 | 19,950 | 10,183 | 9,923 |
| 2019 | 24.7 | 5.9 | 7.9 | 20,899 | 10,826 | 9,629 |
| 2020 | 24.1 | 6.2 | 6.8 | 20,329 | 11,467 | 8,261 |
| 2021 | 29.4 | 7.3 | 7.1 | 24,728 | 13,392 | 8,519 |
| 2022 | 24.5 | 7.0 | 6.7 | 20,608 | 12,864 | 7,924 |
| 2023 | 24.8 | 7.6 | 6.5 | 21,490 | 14,052 | 7,790 |
| 2024 | 26.5 | 7.6 | 6.9 | 23,154 | 14,239 | 8,219 |
| 2025 | 7.9 | 7.9 | 14,905 | 9,300 |
Why Is Lithuania’s Company Formation Rate Usually Understated?
Because the World Bank database, the source Baltic comparisons usually cite, counts Lithuania’s UAB and AB but not the small partnership, which is now most of what Lithuanians register. Counting both, Lithuania registered 7.6 companies per 1,000 residents in 2024 rather than 2.1, more than Latvia.
The World Bank database is the source Baltic comparisons usually cite. For Lithuania it counted 4,011 new companies in 2024, which is the register’s count of UAB and AB, the private and public limited company, to within 3.7% in every year since 2014. It does not count the mažoji bendrija, the small partnership, which Lithuanian law makes a limited civil liability private legal entity.
In 2024 Lithuanians registered 10,170 small partnerships and 4,069 UAB and AB. In 2014 it was 1,801 small partnerships and 8,796 UAB and AB: the limited company has been losing ground to the small partnership for a decade.
The rise has not stopped. The register holds 8,700 small partnerships registered in the first half of 2026, against 6,654 in the first half of 2025. LRT reported in January 2026 that experts put the jump down to the previous year’s tax reform, which made working as a self-employed individual more expensive.
New companies in Lithuania by legal form
Show the numbers
| Year | UAB and AB | Small partnership | Total |
|---|---|---|---|
| 2012 | 11,055 | 1,177 | 12,232 |
| 2013 | 8,296 | 2,448 | 10,744 |
| 2014 | 8,796 | 1,801 | 10,597 |
| 2015 | 6,245 | 1,671 | 7,916 |
| 2016 | 6,416 | 2,102 | 8,518 |
| 2017 | 6,616 | 2,934 | 9,550 |
| 2018 | 6,165 | 4,018 | 10,183 |
| 2019 | 5,977 | 4,849 | 10,826 |
| 2020 | 5,416 | 6,051 | 11,467 |
| 2021 | 5,928 | 7,464 | 13,392 |
| 2022 | 5,392 | 7,472 | 12,864 |
| 2023 | 4,781 | 9,271 | 14,052 |
| 2024 | 4,069 | 10,170 | 14,239 |
| 2025 | 4,096 | 10,809 | 14,905 |
Why Does Estonia Register More Companies Than Latvia?
Partly e-Residency: e-residents established 5,556 Estonian companies in 2025, yet without a fifth of its formations Estonia would still register 3.1 times Latvia’s rate. Minimum capital is not the whole story either, because Estonia’s lead predates its 2023 change, and nothing in these sources explains Latvia’s fall.
e-Residency, in part. Estonia’s e-Residency programme lets people who do not live there found and run an Estonian company online. By the programme’s own account, e-residents established 5,556 companies in 2025, 15% more than in 2024, and they establish one in every five new Estonian companies each year. Take a fifth away and Estonia’s 2024 rate is still about 21.2 per 1,000, 3.1 times Latvia’s.
Capital, but not from the start. An Estonian OÜ has had no minimum share capital since February 2023, while a standard Latvian SIA needs EUR 2,800 and a Lithuanian UAB EUR 1,000, as the Baltic comparison guide sets out. Estonia’s lead is older than that change: in 2014 it already registered 16.0 per 1,000 against Latvia’s 10.6.
Latvia’s fall is unexplained here. Nothing in these sources says why Latvia registers fewer companies per resident than it did in 2014, and this report does not guess.
Do Businesses Survive Longer in Estonia, Latvia, or Lithuania?
On Eurostat’s common measure, Estonian ones do. Of businesses born in 2021, 62.6% were still active in 2024 in Estonia, 50.1% in Latvia and 43.5% in Lithuania. Estonia starts more businesses per resident and keeps more of them.
Eurostat measures survival the same way in every member state: enterprises of every legal form, sole traders included, born in one year and still active three years later.
Eurostat changed its business demography method from reference year 2021, so older cohorts come from a different table, and three-year survival for businesses born 2018 to 2020 is not published in either. Read the older rows as the same countries on a slightly different definition.
Businesses still active three years after birth, born 2021
- Estonia62.6 %
- Latvia50.1 %
- Lithuania43.5 %
Show the numbers
| Born | Estonia | Latvia | Lithuania | Method |
|---|---|---|---|---|
| 2007 | 43.4% | 45.2% | 22.8% | to 2020 |
| 2008 | 67.7% | 49.0% | 23.5% | to 2020 |
| 2009 | 56.5% | 46.9% | 39.8% | to 2020 |
| 2010 | 61.6% | 48.7% | 40.2% | to 2020 |
| 2011 | 59.4% | 58.5% | 43.0% | to 2020 |
| 2012 | 57.8% | 55.1% | 39.9% | to 2020 |
| 2013 | 57.2% | 57.0% | 37.2% | to 2020 |
| 2014 | 58.4% | 53.9% | 39.4% | to 2020 |
| 2015 | 56.5% | 46.9% | 37.8% | to 2020 |
| 2016 | 55.0% | 44.6% | 38.5% | to 2020 |
| 2017 | 52.0% | 46.5% | 38.0% | to 2020 |
| 2021 | 62.6% | 50.1% | 43.5% | from 2021 |
Why Can the Baltic Registers Not Settle Company Survival?
Because a register records when it deletes a company, not when the company stopped trading. Lithuanian UAB and AB struck off from 2014 to 2025 were a median 13.1 years old, against 8.2 for Latvian SIA and AS, so a dormant Lithuanian company counts as a survivor for longer.
Both registers can be read the way the company survival report reads Latvia’s: the share of each year’s companies not yet struck off at 36 months. For companies registered in 2022 that gives 87.1% in Latvia and 96.7% in Lithuania, the opposite order from Eurostat’s.
Only 2.1% of Lithuanian UAB and AB struck off were removed within 36 months of registration, against 9.6% in Latvia. Lithuania also removes them in waves: 14,100 in 2022, 13,450 in 2023, and 18,863 in 2024, each more than twice any other year since 2012.
A register that removes a dormant company years after it stops trading counts it as a survivor until then. That is why survival is compared on Eurostat above, and the register figures are published only to show the problem. Estonia’s register cannot be read this way at all, because its open data lists only companies that still exist.
Median age of companies when the register struck them off
Show the numbers
| Year | Struck off, LV | Median age, LV | Struck off, LT | Median age, LT |
|---|---|---|---|---|
| 2014 | 3,691 | 7.5 | 1,766 | 9.0 |
| 2015 | 6,350 | 7.9 | 2,486 | 10.7 |
| 2016 | 9,069 | 7.5 | 5,834 | 20.8 |
| 2017 | 14,200 | 9.9 | 2,683 | 9.7 |
| 2018 | 18,962 | 10.6 | 2,563 | 8.9 |
| 2019 | 22,261 | 8.2 | 2,378 | 9.0 |
| 2020 | 10,411 | 7.2 | 1,858 | 10.0 |
| 2021 | 12,193 | 7.6 | 6,587 | 20.1 |
| 2022 | 9,456 | 7.3 | 13,906 | 23.4 |
| 2023 | 6,212 | 8.0 | 13,405 | 12.3 |
| 2024 | 8,083 | 7.9 | 18,817 | 10.9 |
| 2025 | 6,525 | 8.2 | 6,200 | 11.5 |
Companies still on the register at 36 months
Show the numbers
| Registered | Latvia, formed | Latvia, still registered | Lithuania, formed | Lithuania, still registered |
|---|---|---|---|---|
| 2015 | 12,610 | 91.0% | 7,916 | 97.5% |
| 2016 | 10,370 | 89.3% | 8,518 | 97.5% |
| 2017 | 9,401 | 89.2% | 9,550 | 97.5% |
| 2018 | 9,923 | 89.2% | 10,183 | 97.7% |
| 2019 | 9,629 | 87.2% | 10,826 | 98.2% |
| 2020 | 8,261 | 88.0% | 11,467 | 98.0% |
| 2021 | 8,519 | 88.2% | 13,392 | 97.4% |
| 2022 | 7,924 | 87.1% | 12,864 | 96.7% |
What Can Baltic Company Formation Data Not Tell You?
Foreign ownership and share capital in all three countries, because Lithuania’s open data carries neither and Estonia’s covers only companies that still exist; how many of these companies are startups, since no register marks one; and why Latvia’s formation rate fell, because the registers count companies, not reasons.
- Foreign ownership in all three countries. The Lithuanian open data carries no owners, and Estonia’s covers only companies that still exist. Latvia’s is in the foreign ownership report.
- Share capital at formation. The Lithuanian open data carries no capital, and Estonia’s again covers only survivors. The statutory minimums are compared above, and Latvia’s registered capital is in the share capital report.
- How many of these companies are startups. No register marks one, and the three countries share no definition of one.
- Why Latvia’s rate fell. The registers count companies, not reasons.
Frequently Asked Questions
How Many Companies Does Latvia Register Each Year?
Latvia registered 8,219 SIA and AS in 2024, or 6.9 per 1,000 residents aged 15 to 64, against 10.6 per 1,000 in 2014.
What Is a Lithuanian Small Partnership?
A mažoji bendrija, or MB, is a limited civil liability private legal entity under Lithuanian law. In 2024 Lithuanians registered 10,170 small partnerships against 4,069 UAB and AB.
How Many Companies Do e-Residents Found in Estonia?
By the e-Residency programme’s own account, e-residents established 5,556 Estonian companies in 2025, 15% more than in 2024.
Does Minimum Share Capital Explain Estonia’s Lead?
Not on its own. An Estonian OÜ has had no minimum share capital since February 2023, but Estonia’s lead is older: in 2014 it already registered 16.0 companies per 1,000 residents against Latvia’s 10.6.
Where Does the Baltic Company Formation Data Come From?
Latvia from the Uzņēmumu reģistrs, Lithuania from Registrų centras, Estonia from the World Bank Entrepreneurship Database, population from Eurostat, and three-year business survival from Eurostat business demography.
Method
- Limited-liability companies only. Latvia: SIA and AS. Lithuania: UAB, AB and the small partnership. Estonia: new limited liability companies as the World Bank counts them. Sole traders are not counted in any formation figure.
- Year of registration. The date each register carries, against the legal form a company has today. A company that converted keeps its original date.
- Per 1,000. Formations divided by Eurostat population aged 15 to 64 on 1 January of the same year.
- Register survival. The company survival report’s rule: a year’s companies appear only once every one of them has reached 36 months, and no share is published over fewer than 200 companies.
- Withheld counts. A count from 1 to 19 is shown as fewer than 20. Lithuania’s AB, the public limited company, is under that line every year, so it is always shown together with the UAB.
Definitions are frozen at version 4. The full set is on the methodology page.
Cite This
Sageo SIA (2026). Company Formations in the Baltic States. Riga Startups. Computed from Uzņēmumu reģistrs open data, extract of 4 September 2026; Registrų centras open data, extract of 10 September 2026; the World Bank Entrepreneurship Database; and Eurostat, updated 4 September 2026. https://rigastartups.com/reports/baltic-formation-comparison
Permalink: https://rigastartups.com/reports/baltic-formation-comparison · CSV for this edition
The registers, the World Bank and Eurostat publish these data free to reuse with attribution. This analysis is offered on the same terms: credit the sources and link back.
Sources
- Uzņēmumu reģistrs open data, the Latvian Register of Enterprises. Extract of 4 September 2026.
- Registrų centras open data, registered and deregistered legal entities in Lithuania. Extract of 10 September 2026.
- World Bank Entrepreneurship Database, new limited liability companies.
- Eurostat business demography by size class (bd_size) and its predecessor (bd_9bd_sz_cl_r2), three-year survival rates.
- Eurostat population on 1 January by broad age group (demo_pjanbroad).
- Lithuanian Law on Small Partnerships, article 2.
- e-Residency blog, on companies founded by e-residents and their state revenue in 2025 , published 6 February 2026.
- LRT, “Auga įsteigtų mažųjų bendrijų skaičius”, on the growth in small partnerships, 13 January 2026.